SORTraceViewer Help
SORTraceViewer has an extensive set of functions for viewing, analyzing and editing OTDR traces
Reports, summary tables, import from other formats and much more
Help
- Installation
- Viewing OTDR traces
- Viewing other trace formats (import)
- Export
- Application interface
- Bidirectional viewing mode
- Application settings
- Reports
- Pivot tables
- Automatic OTDR trace analysis
- Creating new OTDR traces
- Editing measurement parameters
- Editing trace parameters
- Editing events
- Additional editing functions
- Frequently Asked Questions
Simply unpack the archive into any folder. For Windows, for example: "C:\SORTraceViewer" For Linux, for example: "/opt/SORTraceViewer"
Open any number of *.sor traces using "Menu -> File -> Open", the toolbar button, or simply drag and drop files onto the application window.
You can also drag and drop a folder with OTDR traces onto the main window
To view other types of OTDR traces, e.g. *.trc, select the main menu item "File->Import", or simply drag and drop files onto the main window of the application.
The following file formats are supported: *.trc, *.msor, *.csor, *.tst
Note: *.tst files are created by Fluke Networks measuring instruments and do not always contain OTDR traces
You can save the OTDR trace in Exfo .trc format (available only in the Pro version). Right-click on the file list. Select "Export" from the menu.
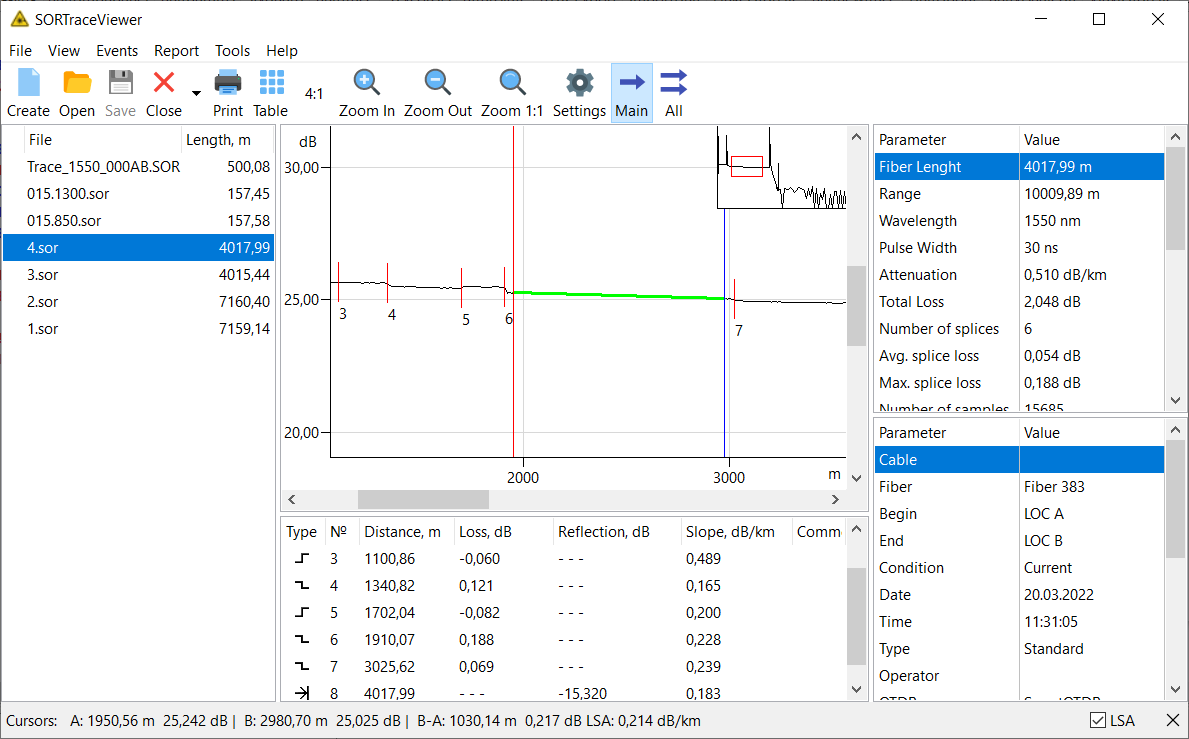
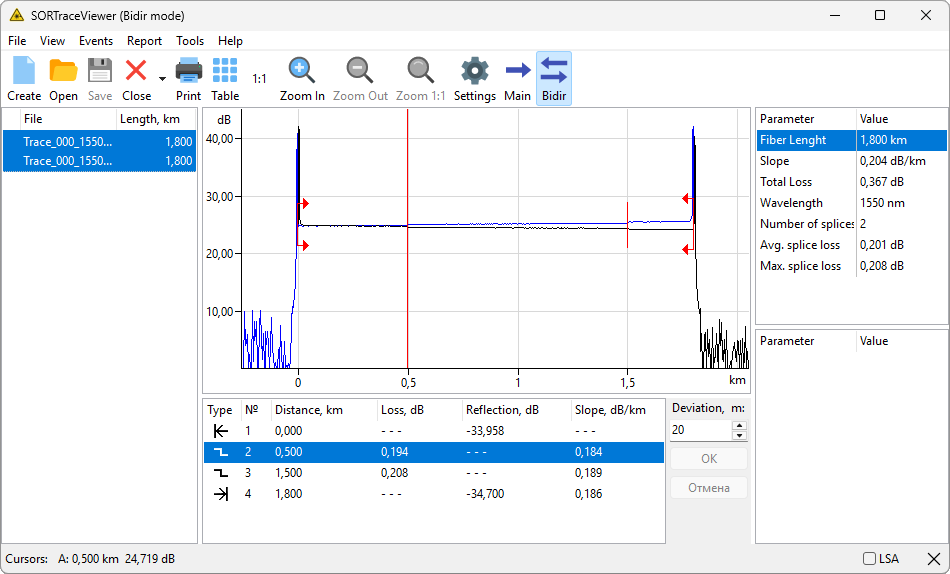
Select the menu item "Tools -> Bidirectional mode". To load the reverse trace, double-click on the file name.
Also, to load all reverse traces, right-click on the file list and select "Open reverse traces from folder" from the menu.
In the file selection window, select the required traces. The application will load reverse traces based on parameters such as fiber length, range, and fiber number (the fiber number must match for the forward and reverse traces).
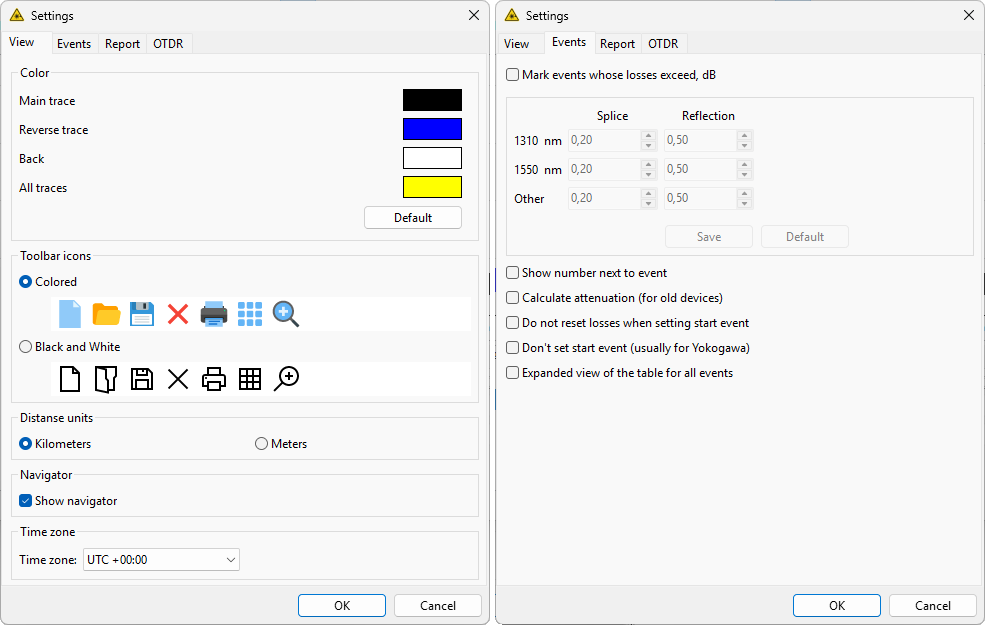
In the "Appearance" tab, you can configure the application interface parameters.
In the "Events" tab, you can configure parameters related to trace events.
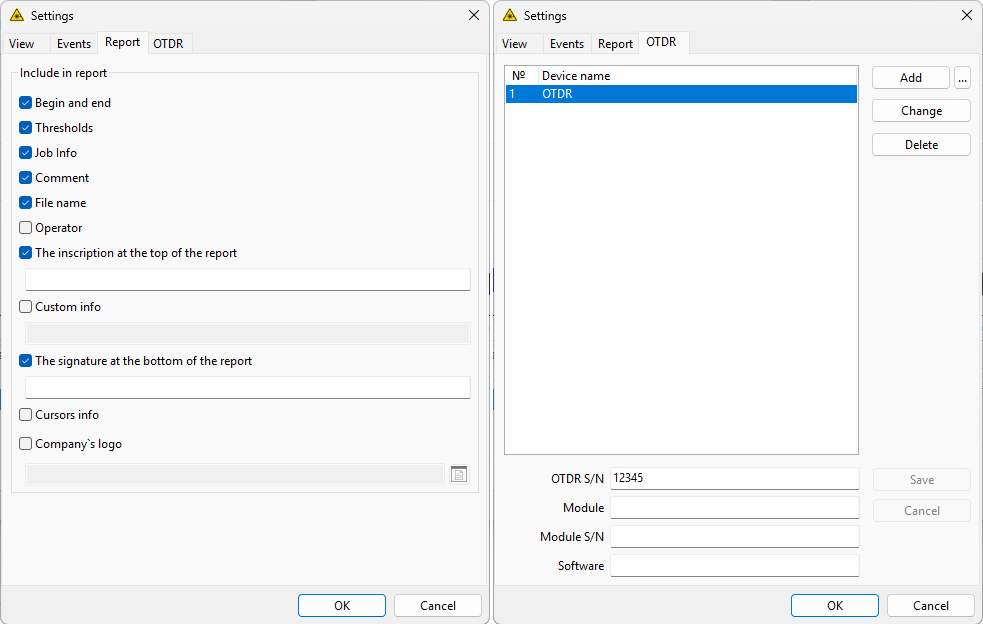
In the "Report" tab, you can configure the data that will be displayed in the report, for example, add a company logo.
In the "OTDR" tab, you can configure virtual OTDRs used when creating traces
To print a trace report, click the printer icon button (or select the menu item "Report -> Print").
To print a report for all open traces, select the menu item "Report -> Print all"
To save a trace report in MS Excel format, select the menu item "Report -> Trace report to Excel".
To output a report for all open traces in MS Excel format, select the menu item "Report -> All traces report to Excel" (not available in the FREE version)
Click the "Table" button on the toolbar (or select the menu item "Events -> Table"). The program will generate an event table for all loaded traces and offer to save it to a file in MS Excel format.
Note: the results will only make sense if all loaded traces are obtained from the same cable
Note: MS Excel installation on the computer is not required.
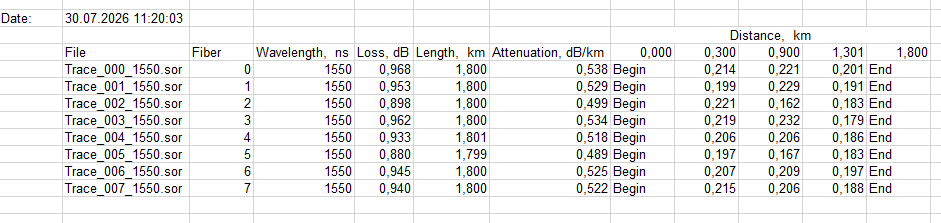
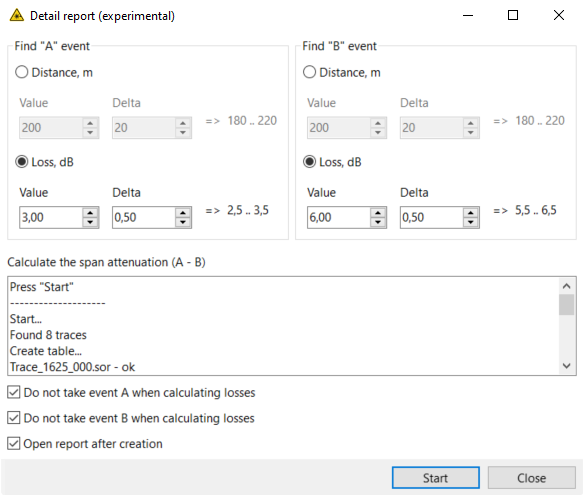
Another type of pivot table can help with GPON network analysis. Select the menu item "Report -> Advanced report". In the window that opens, set the conditions for searching for events "A" and "B". The resulting table will store the fiber loss values between events "A" and "B".
This feature is not implemented yet. If you are familiar with things like Kalman filter or Wavelet analysis, please contact me by e-mail: waydm@yandex.ru
This function allows you to create new trace files of any length (in the FREE version the length is limited to 99 m).
Click the toolbar button, select the menu item "File -> New", or press Ctrl-N.
Set the desired fiber length, add events (if necessary) and click the "Start" button.
Note: You use this function at your own risk. You must be aware that the created traces are the result of simulation. Under no circumstances shall the author be liable for any direct, indirect or consequential damages arising from the use of this function.
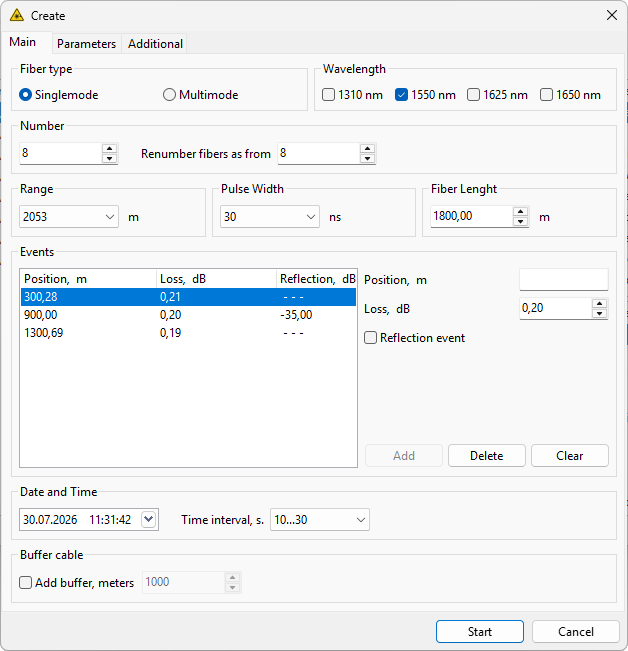
Here you can select the main parameters of the new trace:
Required wavelengths, fiber length, number of traces to create, range, and add necessary events
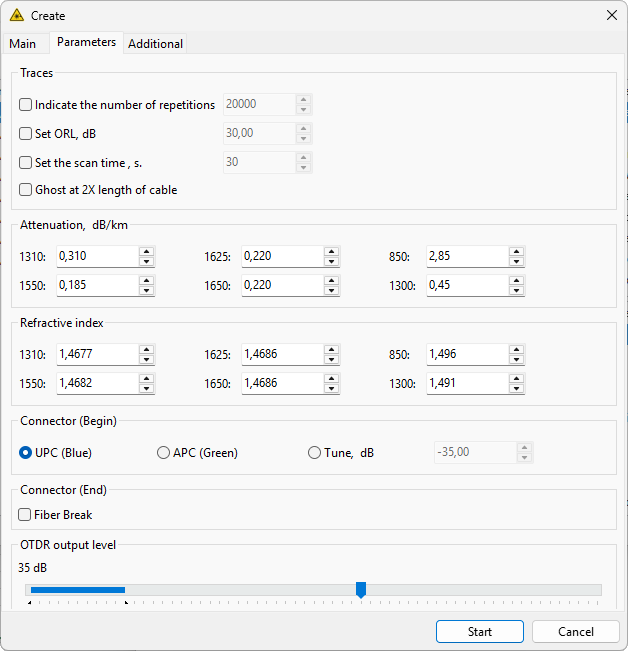
Here you can select the fiber attenuation value, connector type, etc.
Here you can select the virtual reflectometer model, cable and work information, and also file naming template
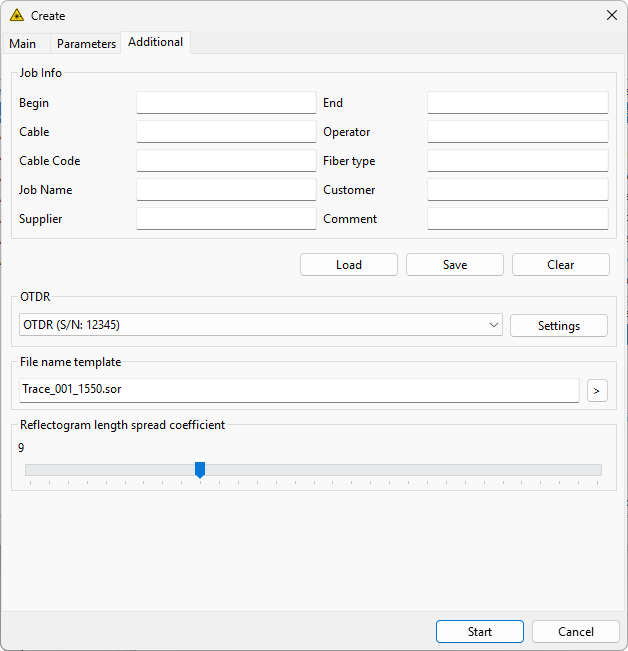
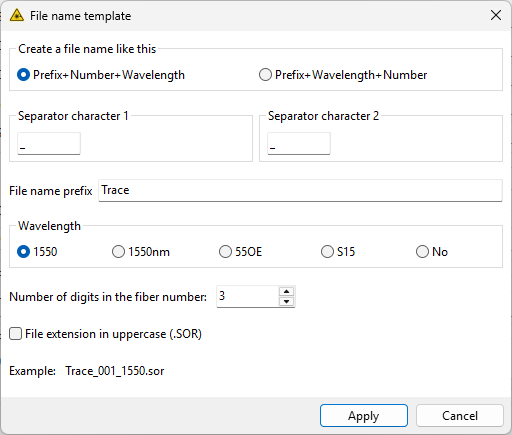
The names of the created files are assigned according to a template. To change it, in the "Additional" tab of the trace creation window, click the ">" button on the right in the "File naming template" panel.
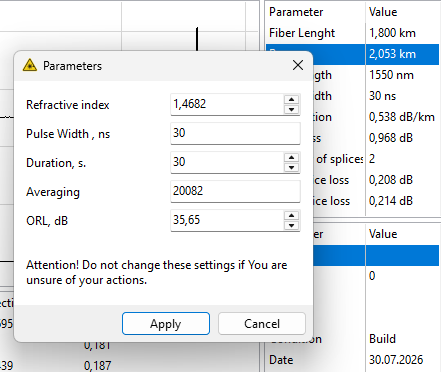
Right-click on the measurement parameters table (top-right). Select "Edit parameters" from the menu.
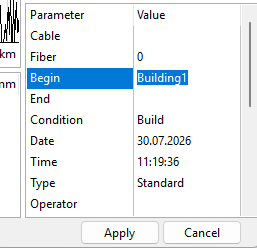
Double-click on the trace parameters table (bottom-right). Change the values directly in the table.
To apply the changes, click the "Apply" button in the status bar.
Event editing functions are located in the main menu item "Events"
- "Add event" - set the red cursor at the desired position and select this item
Select the desired event. After that, other editing functions become available:
- "Delete event"
- "Properties"
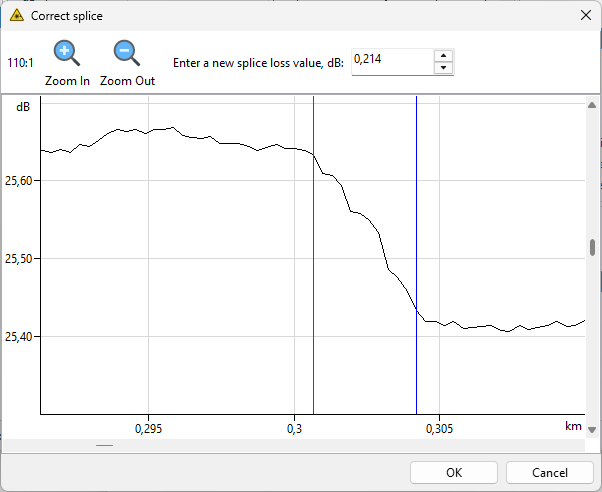
- "Change loss" - change the loss value ("step") at the event
- "Change reflectance" - change the reflectance
- "Change attenuation" - change the kilometer attenuation of the previous section of the trace
- "Set fiber start" - the trace will start from the selected event
- "Set fiber end" - the trace will end at the selected event
- "Table" - create a common event table for all open traces
Additional editing functions are available in the "Tools" main menu item.
- "Batch conversion" - changes trace information for all open traces. You can also change the date and time and renumber fibers.
- "Batch conversion 2" - changes the refractive index, measurement duration, and pulse for all open traces.
- "Noise reducer" - changes the noise level in the section from cursor A (red) to cursor B (blue).
- "Change parameters" - editing of "Measurement parameters"
- "Visual editing" - manual editing of the trace graph. For example, you can remove a ghost pulse.
- "Trim trace" - cuts out sections of the trace to the left of cursor A (red) and to the right of cursor B (blue).
How to save traces with the .SOR extension (uppercase letters)?
— Check the corresponding checkbox in the "File naming template" window.
How to quickly open the folder where the trace file is stored?
— Left-click on the file name in the status bar at the bottom of the main window.
How to save a report in PDF format?
— When printing the report, select a PDF printer. For example, in Windows 10 this is "Microsoft Print to PDF".